Dashboard Overview
The SimpleBillBook dashboard is your central command center for monitoring business performance. It provides real-time insights into your sales, inventory, customers, and financial health at a glance.
Dashboard Layout
The dashboard is divided into several key sections that give you a comprehensive view of your business operations.
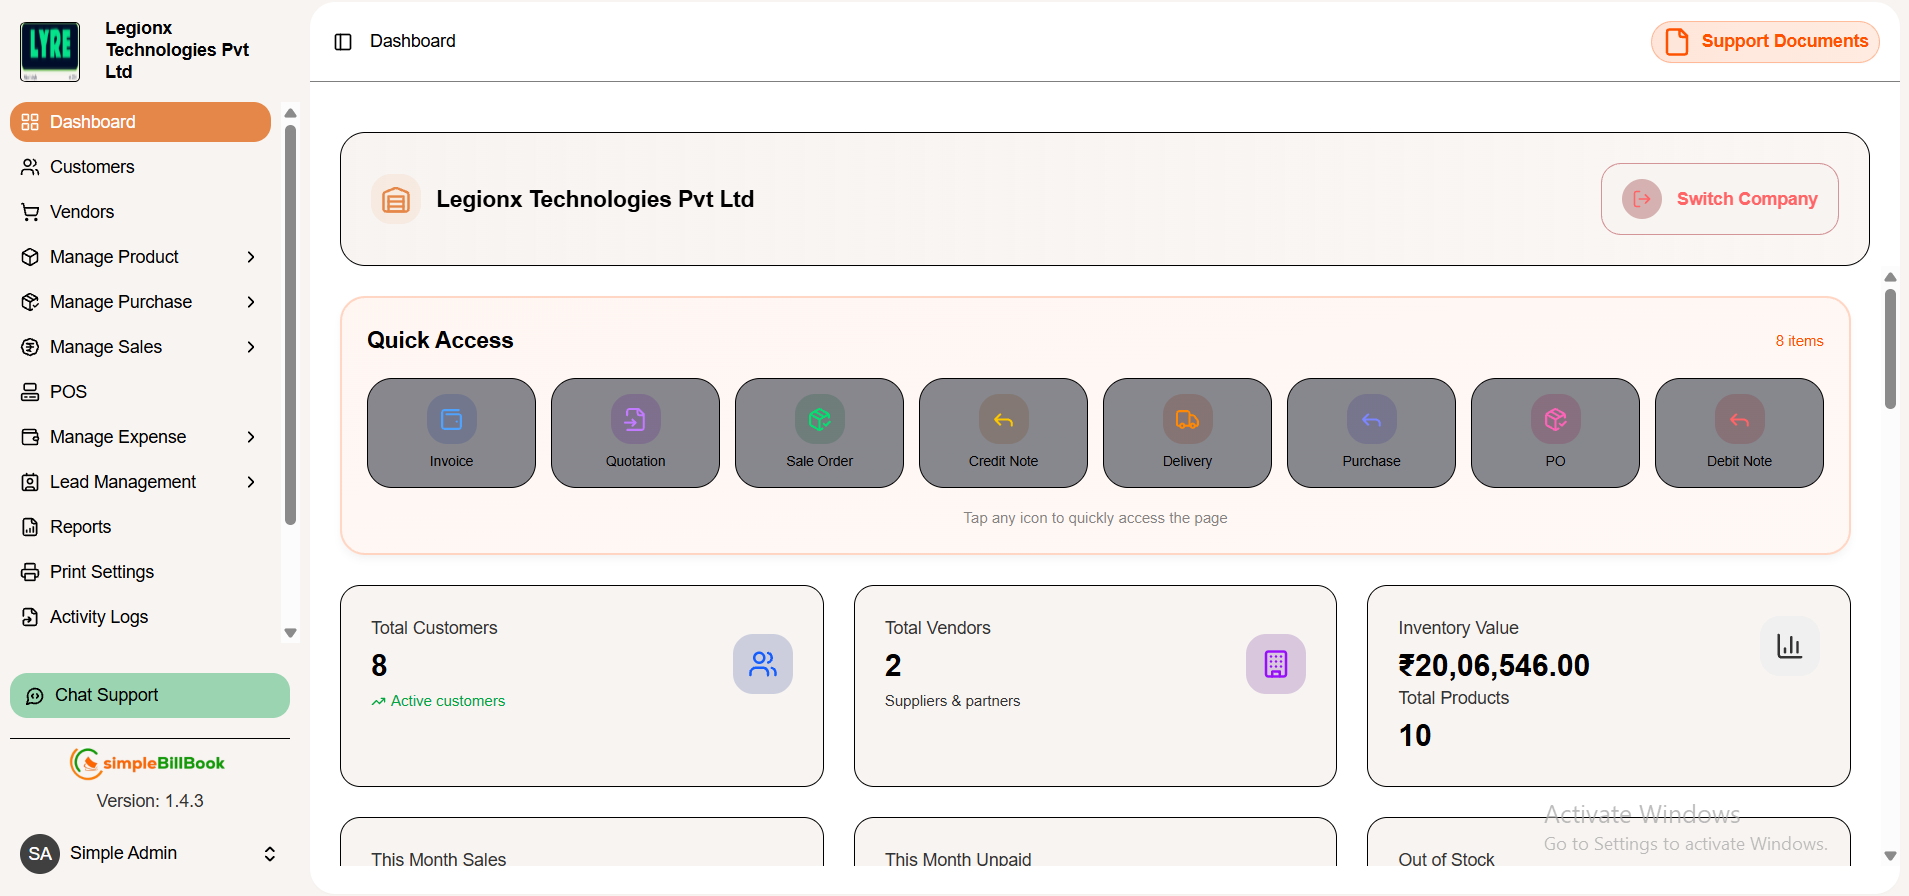 Figure 1: Main dashboard showing key metrics and performance indicators
Quick Access
Provides shortcut access to frequently used business operations and transaction modules.
Sidebar Navigation
The left sidebar provides quick access to all major modules:
| Menu Item | Description |
|---|---|
| Dashboard | Home screen with overview metrics |
| Customers | Manage customer database |
| Vendors | Manage supplier information |
| Manage Product | Products, categories, and barcodes |
| Manage Purchase | Purchase entries, orders, debit notes |
| Manage Sales | Invoices, quotations, sales orders |
| POS | Billing, barcode scanning, quick checkout, and payment processing |
| Manage Expense | Expense categories and entries |
| Lead Management | Track potential customers |
| Reports | Business analytics and reports |
| Print Settings | Configure printing options |
| Activity Logs | Audit trail of all actions |
| Manage Users | User accounts and access control |
| Manage Company | Company profile and settings |
| Subscription Plans | Billing and plan management |
Key Metrics Dashboard
The top section displays critical business metrics in easy-to-read cards:
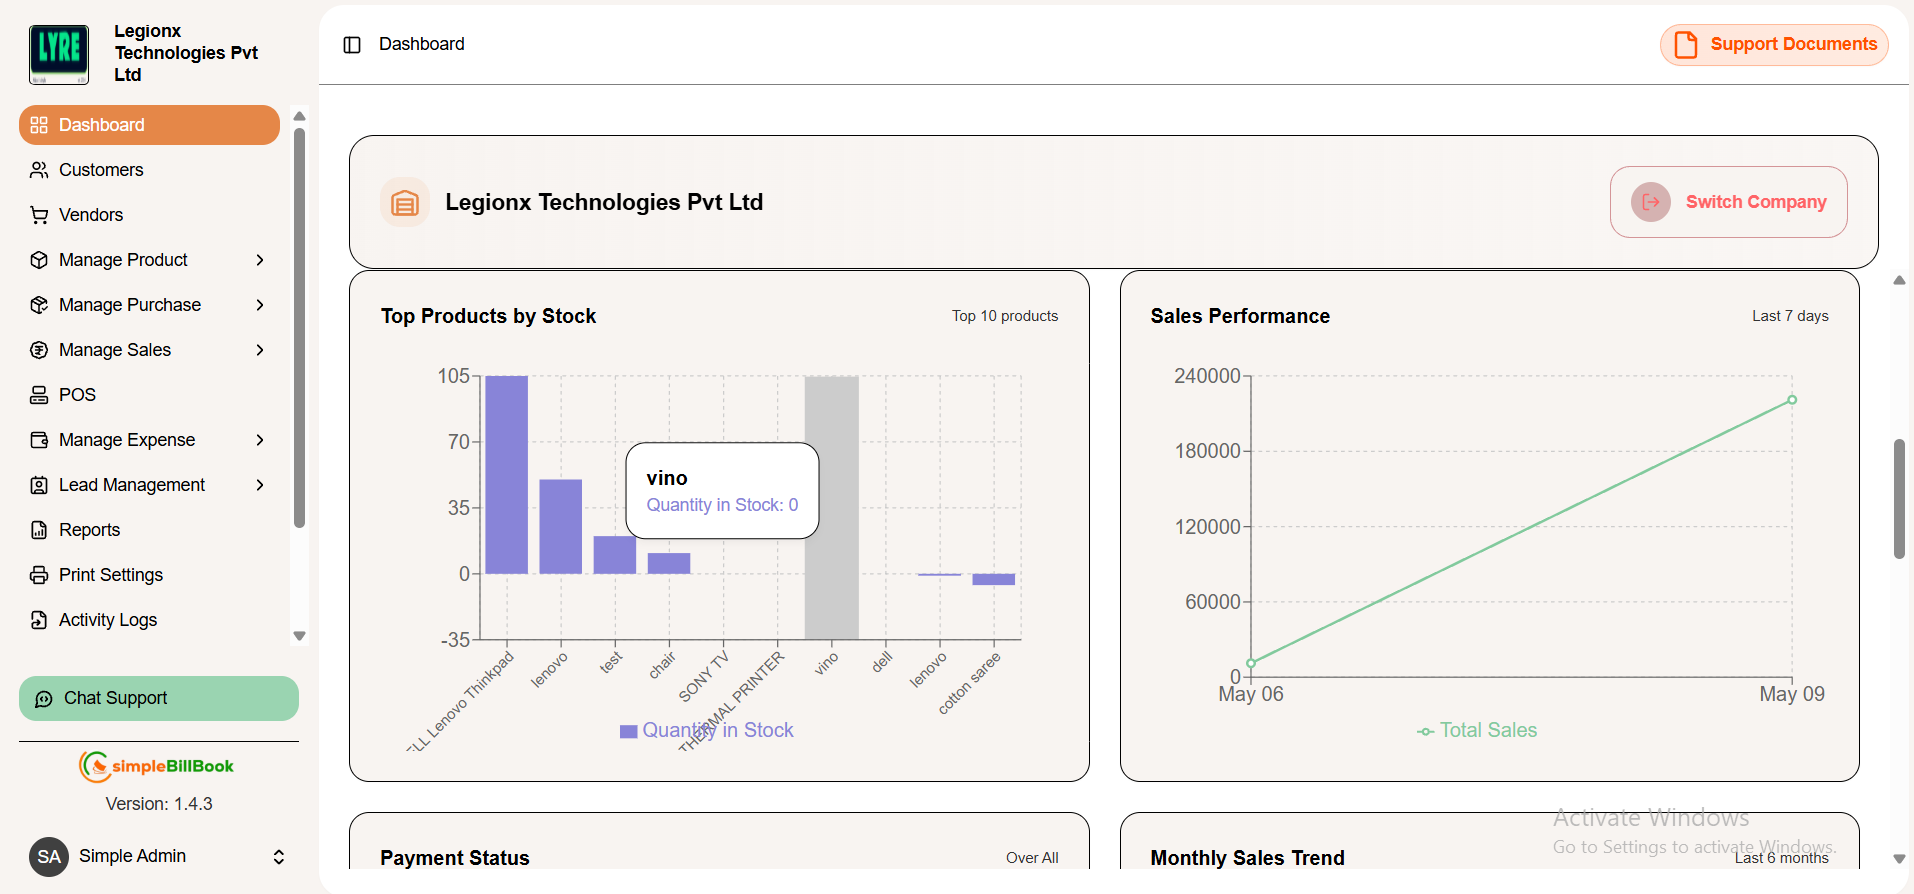 Figure 2: Dashboard with detailed metrics, charts, and recent transactions
Metric Cards
| Metric | Value (Example) | Description |
|---|---|---|
| Total Customers | 8 | Number of active customers |
| Total Vendors | 2 | Number of suppliers & partners |
| Inventory Value | ₹20,06,546.00 | Current stock value |
| This Month Sales | ₹15,050.32 | Sales with +100% growth |
| This Month Unpaid | ₹15,050.32 | Sales with +100% growth |
| Out of Stock | 6 | Items needing restock |
Visual Indicators
- Active customers - Subtitle under customer count
- Suppliers & partners - Subtitle under vendor count
- Total products - Subtitle under Inventory value count
- Current stock value - Subtitle under inventory value
- +-92.65% from last month - Growth indicator for month sales
- Restock required - Alert for out-of-stock items
- Pending Payments - Subtitle under the month Unpaid
Top Products by Stock
Monitor your highest inventory items:
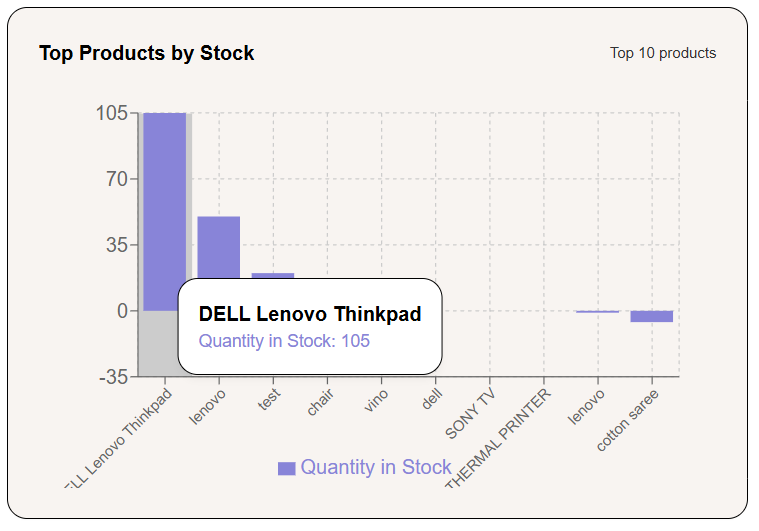
Displays products with the highest available inventory quantity to the lowest for stock monitoring and management.
- Product Name – Name of the inventory item.
- Stock Quantity – Available units in stock.
- Inventory Insights – Helps track high-stock products and inventory levels.
Sales Performance
Visual representation of sales trends:
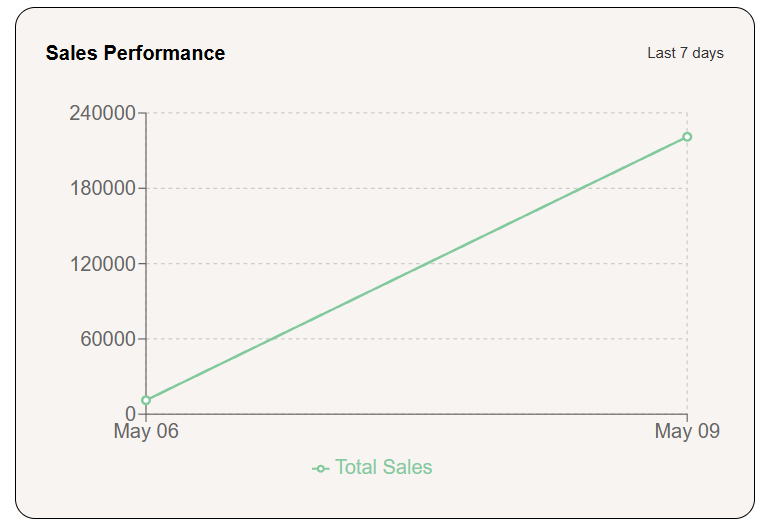
Displays sales trends over time on transaction dates and sales amounts.
- Sales Date – Tracks sales activity by date
- Sales Amount – Displays revenue generated
- Trend Analysis – Helps monitor sales growth and performance over time
Payment Status
Visual representation of payment status:
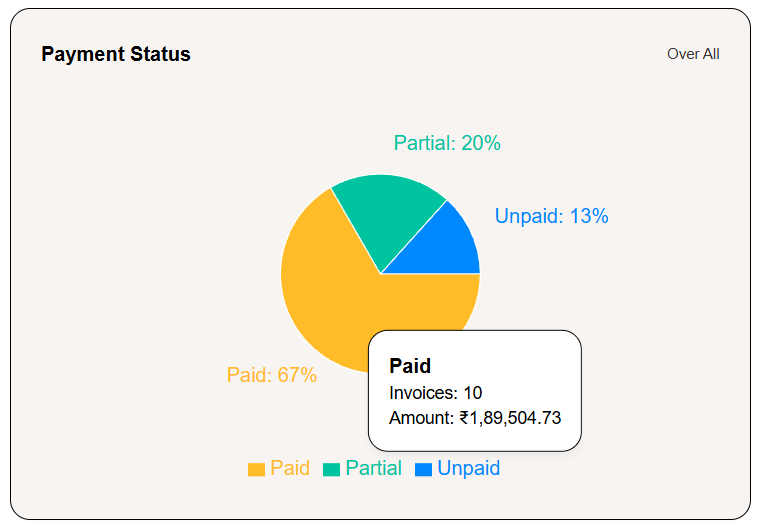
Displays the overall invoice payment distribution for quick financial tracking.
- Paid – Fully completed payments.
- Partial – Partially completed payments.
- Unpaid – Pending or unpaid invoices.
Monthly Sales Trend
Visual representation of monthly sales trend:
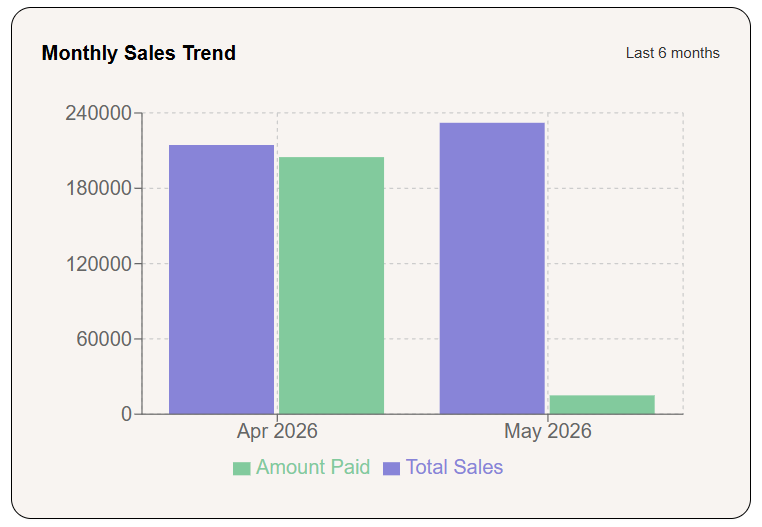
Displays sales performance and payment amounts over recent months for business analysis.
- Total Sales – Overall sales generated each month
- Amount Paid – Payments received from customers
- Monthly Comparison – Tracks sales growth and revenue trends
Recent Sales
Visual representation of Recent Sales:
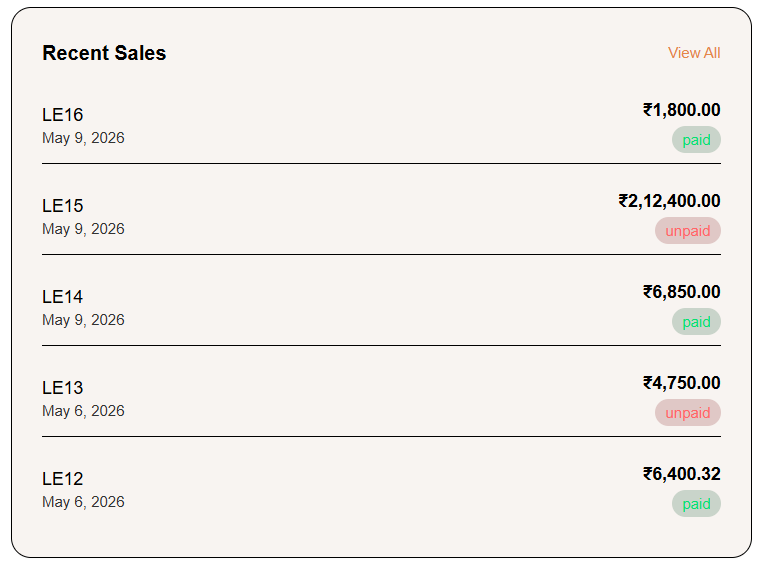
Displays the latest customer sales transactions with invoice details and payment status.
- Invoice Number – Unique sales invoice reference
- Sale Amount – Total billed amount
- Payment Status – Indicates paid or unpaid invoices
- Transaction Date – Date of the sales entry
Recent Purchases
Visual representation of Recent purchases:
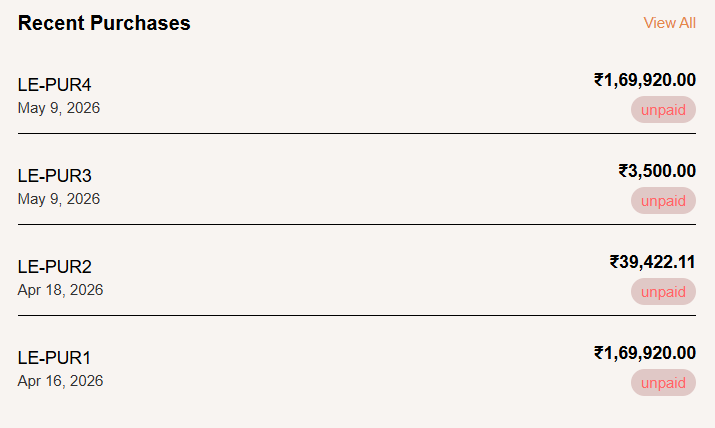
Displays the latest purchase transactions from vendors and suppliers.
- Purchase ID – Unique purchase reference number
- Purchase Amount – Total purchase value
- Payment Status – Indicates paid or unpaid purchases
- Purchase Date – Date of the purchase entry
Recent Quotations
Visual representation of Recent Quotations
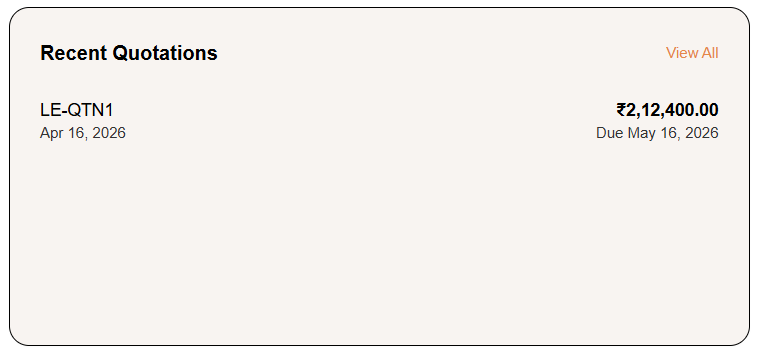
Displays recently created customer quotations with amount and due date details.
- Quotation ID – Unique quotation reference number
- Quotation Amount – Estimated sales amount
- Due Date – Validity date of the quotation
- Quotation Date – Date the quotation was created
Recent Credit Notes
Visual representation of recent Credit Notes
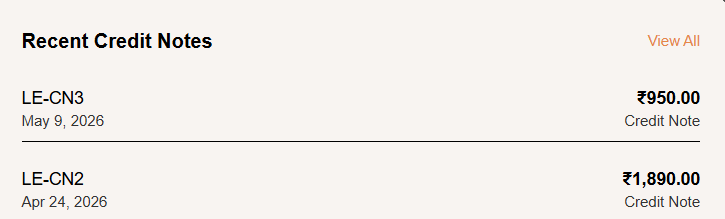
Displays recently generated credit notes issued for customer refunds or adjustments.
- Credit Note ID – Unique credit note reference number
- Credit Amount – Amount adjusted or refunded
- Credit Note Status – Indicates issued credit note entries
- Created Date – Date the credit note was generated